Sanami Tatekura (NIR Application Specialist – ASPAC), AB Vista
Alejandro Criado (Business and Technical Manager– ANZand ASPAC), AB Vista
Near-infrared (NIR) spectroscopy is a familiar sight in the animal feed industry and is indispensable to the daily operations of feed production. Proximate analyses are the most common usage of NIR spectroscopy, but as more calibrations are developed over the years, we are seeing this being taken to measure particle size, amino acid composition, fibre content, and mixing homogeneity to name a few. As feed ingredients prices are volatile and increasing pressure on production cost, animal feed producers need to focus on precise and reliable formulation that will maximise animal performance at the least feed cost. This is where NIR spectroscopy comes into play and where it can be the most beneficial to feed producers.
NIR spectroscopy is one of the most important tools in quality control. This technology has been around for decades and is being used in a wide range of industries for a variety of applications. What is attractive about NIR spectroscopy is that it generates results fast, contributes to less waste, and is relatively cheaper than the wet chemical methods. NIR spectroscopy relies on the interaction between light (NIR light) and matter (the sample being analysed), which in tandem with mathematical formulae called calibrations, brings to light a myriad of chemical and physical information about the sample being analysed, all within minutes.
Not all NIR calibrations are of the same complexity or are the most extensive in coverage, so it is important to use a calibration that best fits the purpose in question. One of the bigger debates out there is whether large universal calibrations perform better than locally developed calibrations.
To develop a large dataset of feed and feed ingredients, samples are collected over a span of years covering different geographical regions, seasons, and feed formulations.This makes calibrations based on larger datasets more robust and accurate as compared to calibrations based on smaller datasets.Incorporating more samples in a datasetto cover a wider range of variability, makes such calibrations “universal” in the sense that it can better account for differences, minimal or otherwise, between unknown samples.In order to predict a new unknown sample, seven years of seasonal variation is required in the NIR database.
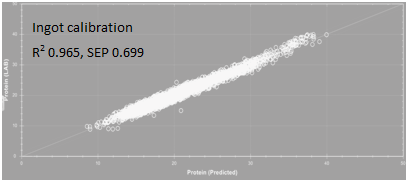
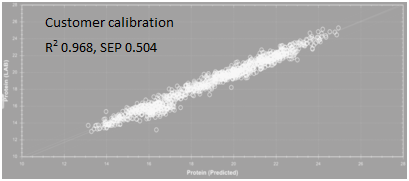
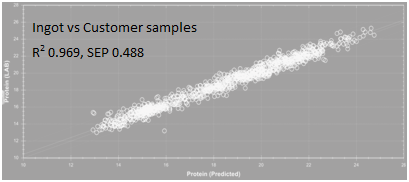
To illustrate the performance differences, here we take the example of two NIR calibrations to measure crude protein in poultry feed; one was made using a poultry feeddataset consisting of 20,000 samples collected globally(Ingot calibration, Figure 1) and the other was made using a locally developed poultry feed dataset consisting of 1,000 samples, all from a customer’s feed mill(customer calibration, Figure 2). Looking at each calibration, the correlation (R2) between predicted and wet chemistry values are both excellent (Ingot R2 0.965, SEP 0.699; Customer calibration R2 0.968, SEP 0.504). Although the standard error of prediction (SEP) is higher in Ingot, the difference is statistically insignificant and is attributed to the larger range and variability of protein values in Ingot compared to the customer calibration. Now, when each calibration is tested against the other sample set, the difference in their performance becomes more distinct. Figure 3 shows how the customer calibration performs when predicting unknown samples from other feed mills. There is a significant reduction in correlation between predicted and wet chemistry results, while SEP is notably higher(R2 0.757, SEP 1.910). This is because the customer calibration was developed using only their own samples which do not cover the variability seen in poultry feed formulations from other feed mills. On the other hand, as depicted in Figure 4, the Ingot calibration database is able to predict the customer’s samples with similar performance as the customer calibration, even though Ingot has never “seen” the customer’s samples before (R2 0.969, SEP 0.488). This case study shows that having a calibration that encompasses greater variability in samples will be able to predict unknown samples with better accuracy.

NIR calibrations are in some ways like people; how we perform in our daily tasks is dependent on how much and what kind of things we have experienced before. We learn by observation and from experience. As we are developing calibrations, by “exposing” them to a wider variety of samples, the calibration would be able to correctly predict the protein result of the samples they “observe” after development. Consequently, locally developed calibration screated with limited datasets are unable to perform well when exposed to unknown samples that fall outside the variability typically seen in local samples. In comparison, AB Vista’s Ingot data base is based on over 4 million samples collected from around the world, with 30 years of seasonal variation, and can make better predictions with its extensive database.
For feed and feed ingredients where variability is no small factor in quality control, it is important to utilise NIR calibrationsdeveloped from large datasets that can make accurate predictions on a wider range of unknown samples. With accurate predictions come greater confidence in your results, which in turn, ensure greater trust in the quality of your products.