Mycotoxins in raw materials and finished feed are the biggest threat to the animal industry, challenging animal performance and profitability and impacting the feed & food safety. Due to the diversity of their toxic effects and their synergistic properties, mycotoxins pose serious public health concerns even if consumed in low concentrations. An integrated strategy can minimize Mycotoxin associated risks and costs starting with the right and quick assessment of mycotoxin levels in various raw materials and finished feed.
TrouwLab, the customer service laboratory of Trouw Nutrition India located at Hyderabad, carries out analysis of mycotoxins in samples from Pan-India to support our customers in Mycotoxin Risk Assessment. We utilize the analysis and insights to support integrators, feed millers and farmers in managing the mycotoxin risks in the best possible way.
As we present the Mycotoxin Outlook (2021) for India region, we cover overview of the mycotoxin distribution and its concentration in various feeds, raw materials, and species risk assessments.
A total of 1203 samples were analysed and taken into consideration for this report.
The tables (1 & 2) below, give a summary of mycotoxin concentrations in various feeds and raw materials.
Table 1: Mycotoxin concentrations in total dataset (ppb)
| Mycotoxin | # of tests | Average | SD | Median | Minimum | Maximum |
| AFLA | 528 | 24.7 | 33.4 | 10.5 | 0 | 150 |
| DON | 10 | 0 | 0.0 | 0.0 | 0 | 0 |
| FUM | 270 | 1431 | 1555 | 900 | 0 | 5800 |
| OCHRA | 352 | 10.2 | 14.6 | 6 | 0 | 113 |
| T2HT2 | 36 | 4.4 | 4.9 | 2.5 | 0 | 14 |
| ZEA | 7 | 46.3 | 11.6 | 44 | 35 | 65 |
Table 2: Mycotoxin concentration among contaminated samples (ppb)
| Mycotoxin | # of tests | Average | SD | Median | Minimum | Maximum |
| AFLA | 449 | 28.8 | 34.7 | 14.0 | 3.0 | 150 |
| FUM | 199 | 1904 | 1558 | 1200 | 250.0 | 5800 |
| OCHRA | 315 | 11.3 | 15.1 | 7.0 | 2.0 | 113 |
| T2HT2 | 7 | 13.1 | 0.9 | 13.0 | 12.0 | 14 |
| ZEA | 7 | 46.3 | 11.6 | 44.0 | 35.0 | 65 |
As shown in table 2, the average concentration for aflatoxins was 28.8 ppb, with maximum value at 150 ppb. The average contamination concentrations for fumonisins, ochratoxin, T2HT2 and zearalenone were 1903, 11, 13 and 46 ppb, respectively.
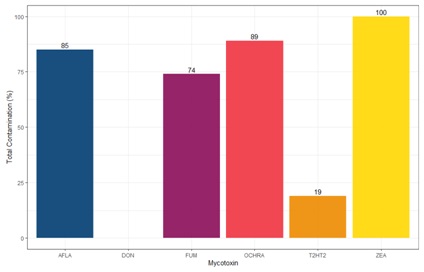
In terms of contamination percentage, samples tested for zearalenone showed 100% contamination, followed by ochratoxin, aflatoxin, and fumonisins at 89, 85 and 74% contamination, respectively (depicted in Fig. 1 below). T2HT2 showed the least 19% contamination amongst the various samples tested.
Mycotoxin Incidence in different types of raw materials and feedstuffs in different regions of India
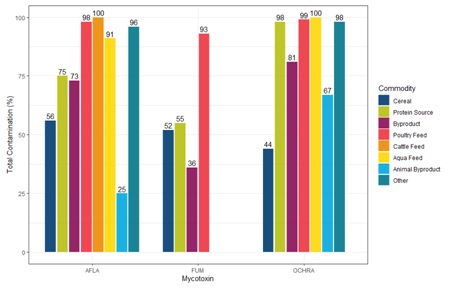
Of the different types of feeds analysed, aflatoxin contamination is more prevalent in the cattle feeds (100%) followed by poultry (98%) and aqua (91%) feeds. Amongst the feed ingredients, both protein source (75%) and cereal by-products (73%) showed highest aflatoxin contamination followed by cereal grains (56%), with the least been in animal by-products (25%). The other category included the ground cake majorly and showed 96% contamination. Fumonisin contamination was highest in Poultry feeds (93%) and the protein sources and cereals showed 50% contaminations each, followed by the by-products (36%). Ochratoxin contamination of more than 95% was observed in aqua feeds (100%), poultry feeds (99), protein source (98%) and others (98%). Cereals showed the least contamination for ochratoxin (44%).
Mycotoxin incidence in Poultry feeds
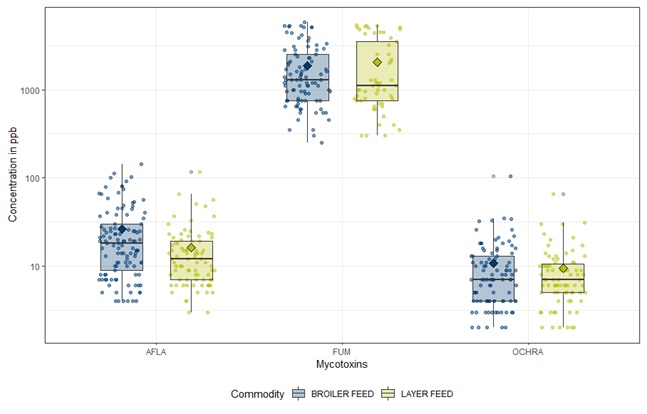
In Broiler feeds, the maximum levels of aflatoxin reached to 144 ppb and to that of 117 ppb in layer feeds. The average value for aflatoxin in broiler and layer feeds were 26 and 16 ppb, respectively, indicating high and medium risk, respectively. The highest ochratoxin levels were at 104 ppb in broiler feeds and at 66 ppb in layer feeds. The median values for both the feeds (12 and 9 ppb) indicated a low risk level for poultry. Fumonisins had almost similar high concentrations in broiler (5800 ppb) and layer (5400 ppb) feeds, with the average values indicating low risk to poultry. Zearalenone and T2HT2 analysis was lower as such for the number of samples analysed and indicated lower contamination levels in the samples tested.
Mycotoxin incidence in Cattle feeds
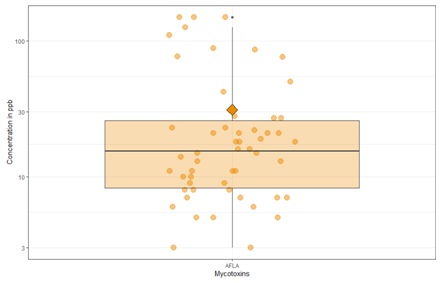
Of the various samples analysed in ruminant feeds, the highest concentration recorded was 150 ppb of aflatoxin, with the average value of 31 ppb, indicating a very high risk for dairy cattle, and its highest probability of M1 concentrations in milk (as AfM1).
Mycotoxin incidence in Aqua feeds
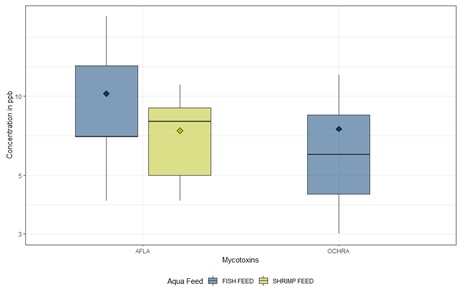
Although the number of samples tested for mycotoxins was low for aqua feeds, the contamination percentage was quite high and ranged from 100% to 83% for aflatoxin in fish and shrimp feeds, respectively.
Mycotoxin Incidence in different Raw materials in India
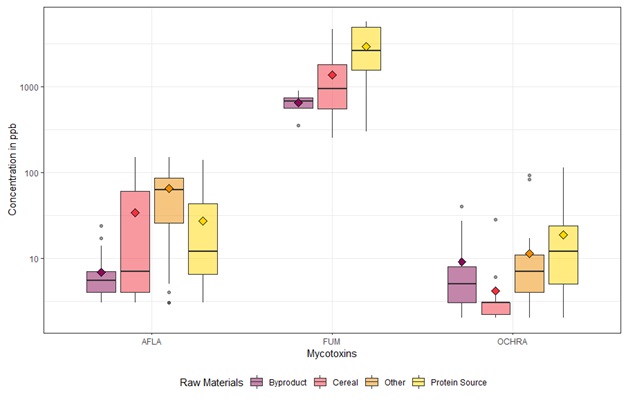
Aflatoxins and Fumonisins presence were majorly seen in cereal grains followed by the protein sources, with the minimal occurrence been in cereal by-products. Highest percentile of aflatoxin was also evident in others category, which majorly constituted the groundnut cake. In contrast to the aflatoxin, ochratoxins were majorly seen in protein sources, others and cereal by-products, with the least been in cereals.
The figures below (7, 8 and 9) show detailed distrubution of various mycotoxins in cereals, protein sources and cereal by-products.
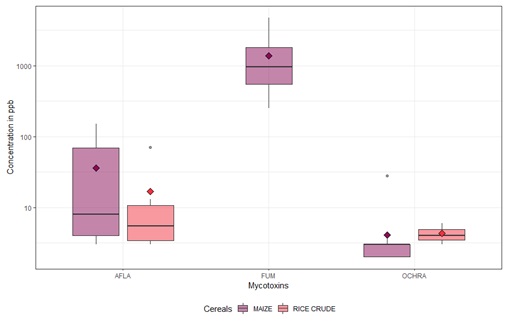
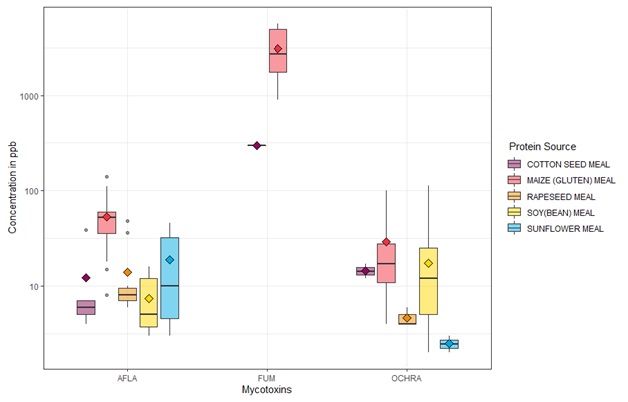
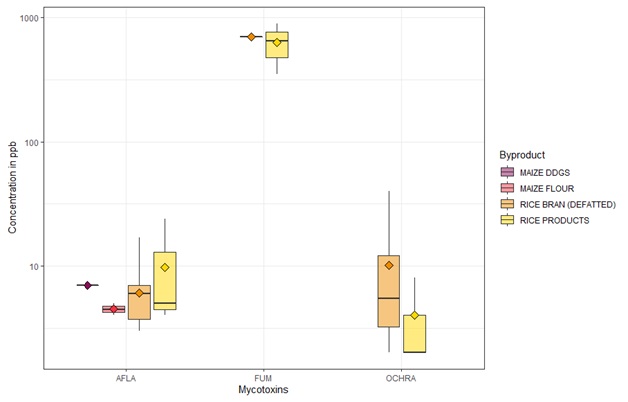
In cereals, aflatoxins and fumonisins were majorly seen in maize, with average concentrations of 50 and 2500 ppb, respectively. Amongst protein sources, aflatoxin prevalence was highest in sunflower meal, with the highest concentration been in maize gluten meal. As per the general trend, ochratoxin had its highest occurrence in soybean, with its highest concentrations in soybean meal and maize gluten meal. Under the category of cereal by-products, higher levels of aflatoxins were noticed in rice by products, whereas higher levels of ochratoxins were reported in DORB. Fibrous raw materials and grain by-products contain high levels of mycotoxin as compared to their parent grains as mycotoxins tend to concentrate on the outer portion of the grains.
Table 3: “Color Code” for mycotoxins in various feed types
| Feed type | Aflatoxins | Ochratoxins | Fumonisins |
| Broiler feed | 26 | 11 | 1860 |
| Layer feed | 16 | 9 | 2039 |
| Ruminant feed | 31 | NA** | NA** |
| Aqua feed | 10 | 8 | NA** |
*Color code: Red – High risk; Orange: Medium risk; Yellow: Low Risk; Green: Safe zone
**Not analyzed (NA)
The species risk assessment, as indicated by colour code, reveals that aflatoxin presents itself as a high risk for broilers and ruminants, followed by a risk of medium category to layer and aqua feeds. Ochratoxins and fumonisins are the other two mycotoxins of concern posing a low risk for broilers and layers. Point to be noted here is that these are the risk categorization when mycotoxins are present individually. As the analysis indicate presence of multiple mycotoxins, there would be high probability of mycotoxin challenges in animals, as aflatoxin, ochratoxin and Fumonisin, have been documented to elicit synergistic or additive effects when present in combination.
Conclusions
Mycotoxins present a permanent challenge for the animal industry because they are widely present in almost all the feedstuffs used in feed production and may affect animal production even in very low concentrations. Fluctuations in animal performance are relatively common, especially in poultry and these are frequently inexplicable. Sudden losses in feed conversion, as well as in other performance parameters could be attributed to mycotoxin contaminated feeds. Aflatoxins effects carry a public health importance in dairy, wherein other than the compromise of animal performance, there is a high risk of carcinogenic implications to human, consequent to carry-over of AfM1 in milk. An integrated holistic approach needs to be adopted to evade mycotoxin challenge in animals. One of the strategies is inclusion of good quality mycotoxin binders regularly in feed at sufficient dosage to combat the effects of mycotoxins in animals, depending on the mycotoxin contamination levels and their types. Majority of the mycotoxins have a negative impact on the immunity and the intestinal integrity. Addition of a broad-spectrum toxin binder, in these scenarios, will aid in protecting the gut integrity and boosting up the immunity of the animal. Rapid, robust, and accurate analysis of different mycotoxins at field level, will provide a quick judgement of the quality of raw material and finished feed and enable the producer to take quick decisions effectively.
Abbreviations used in the analysis
AFLA: Aflatoxins; DON: Deoxynivalanol; FUM: Fumonisins; OCHRA: Ochratoxins; T2HT2: T2 and HT2 Toxin; ZEA: Zearalenone
For further information on the Mycotoxin outlook for 2021 and mycotoxin risk management program, kindly write to us at customercareindia@trouwnutrition.com or visit our website: www.trouwnutrition.in
Avinash Bhat, Dr. Rajesh Pittala & Dr. Sabiha Kadari
Technical Team, Trouw Nutrition India